
17Apr 2019
Semiconductors enable a wide variety of products, from smartphones and computers to cars and industrial equipment. Newly released data on 2018 semiconductor sales by broad product category, known as “end-use,” show sales increased across all categories, while end-use category shares remained remarkably stable from 2017. This is according to the 2018 annual Semiconductor End-Use Survey from the World Semiconductor Trade Statistics (WSTS) organization.
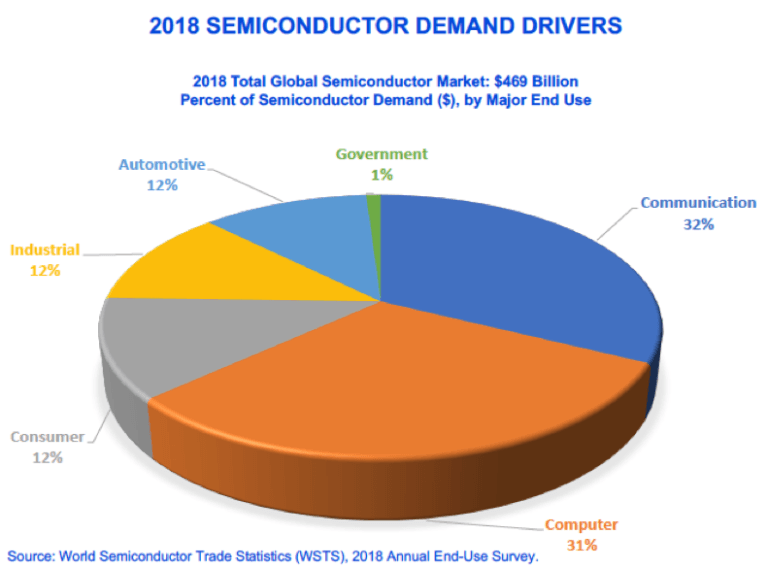
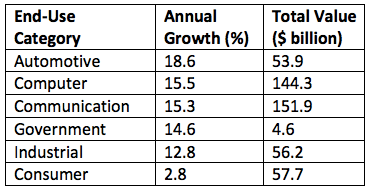
According to the survey, global sales in 2018 increased in all six major semiconductor end-use categories. The overall global semiconductor market grew by 13.7 percent in 2018.
The ranking of end-use by share in 2018 was: communication (32.4 percent), computer (30.8 percent), consumer (12.3 percent), industrial (12 percent), automotive (11.5 percent), and government (1 percent). This order remained unchanged from 2017.
Last year marked the fifth year in a row that communications represented the largest end-use driver for semiconductor sales. As in 2017, communications and PC/computer remained the two largest end-use categories by far in 2018, combining for 63.2 percent of the value of all semiconductors sold in 2018. The share of these two categories, however, declined slightly from 62.3 percent in 2017. The other three major end-use categories—consumer, industrial, and automotive—maintained shares similar to their 2017 amounts.
The 2018 Semiconductor End-Use Survey provides end-use sales data by major end application for all the major semiconductor product sub-segments as well as by major geographic regions, including China, the Americas, Japan, and the EU. Furthermore, the survey presents tables with end-use shares by percentage and by total sales in dollars. With almost 2,000 data points in the entire report, the 2018 Semiconductor End-Use Survey is a valuable resource for anyone interested in understanding semiconductor market trends by end-use.